製造系統管理第七章預習重點(2)
以下Q代表Question、T代表Translation、A代表Answer、E代表Explanation
Q:Use Little’s Law to define the relationship among WIP, CT, and Throughput?
T:使用Little’s Law來定義WIP,CT與產出速率間的關係。
A:
| Little's Law |
E:詳細解說可參考之前寫過的文章Basic Factory Physics-Little'Law
Q:Fill in the following blanks for the best case performance.
T:填滿以下最佳狀況績效的空格。
 |
| The best case performance |
A:
 |
| The best case performance(filled) |
Q:In terms of cycle time and throughput for each WIP level, what is the best case scenario?
T:各個在製品水準下,以生產週期時間與產出速率兩個指標描述何謂最佳情況現象。
A:最小化生產週期時間(CT, Cycle time),使產出(Throughput)最大化。。
E:製造系統在長期平均下,會服從Little’s Law,而根據此定律在各個在製品水準下要達到最大產出,則要最小化生產週期時間(CT, Cycle time)。
Q:In terms of cycle time and throughput for each WIP level, what is the worst case scenario?
T:各個在製品水準下,以生產週期時間與產出速率兩個指標描述何謂最差情況現象。
A:使生產週期時間最大化,讓產出速率最小化。以課本為例,它假設運送批量為系統在製品數量的上限,讓加工完成的工件需等待其他工件加工完成才能進入下一製程加工。
Q:Fill in the following blanks for the worst case performance
T:填滿以下最差狀況績效的空格。
| The worst case performance |
 |
| Cycle Time in worst case |
 |
| Throughput in worst case |
Q:Why do we need practical worst case for benchmarking purpose?
T:為何為了分析比較,我們需要實際最差情況?
A:最佳情況與最差情況間落差非常大,然而都離實際情況有段距離。因此我們需要實際最差情況最為比較基準。
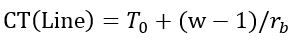
Q:Provide the details leading to the following
equation.
T:提供下式的推導細節。
 |
| Cycle Time for Practical Worst Case |
A:
針對單一加工站而言,若目前有w jobs在系統中,N為生產線的工作站數量,t為加工時間,而各站加工時間皆為t。因此我們可以寫出各站的生產週期時間,如下所示:
因此我們可以寫出各站的生產週期時間,如下所示:
 |
| Cycle Time for Single Workstation |
計算完各站的生產週期時間,則可以計算整個生產線上N個工作站的總和。
 |
| Cycle Time for Production Line |
又Nt為整個生產線各站總和,又可以寫作

而在各站加工時間為t,在加工時間相等狀況下,各站皆是瓶頸工程,每站產出速率皆為

所以整條生產線生產週期時間可以改寫為
 |
| Cycle Time for Production Line(Modify) |
Q:Fill in the following blanks for the practical worst case (PWC) performance.
T:填滿以下實際最差狀況(PWC)績效的空格。
A:
 |
| Cycle Time for PWC |
 |
| Cycle Time for PWC |
Q:Given the following chart, where are “good” and “bad” regions?
T:給定下圖,何處是好的與壞的區域。
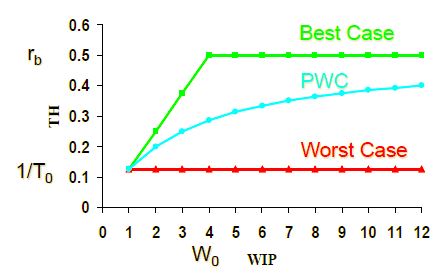
A:以PWC為分界,介於PWC與Best case間為績效較好的區域;反之,介於PWC與Worst case間為績效較差的區域。
E:縱軸為TH,以產出效率作為績效指標,則希望在相同資源下,產出效率高則較好。因此有上述敘述。
Q:Given the following chart, where are “good” and “bad” regions?
T:給定下圖,何處是好的與壞的區域。

A:以PWC為分界,介於PWC與Best case間為績效較好的區域;反之,介於PWC與Worst case間為績效較差的區域。
Q:Recall the Penny fab two. Fill in the blanks both in the following table
and the equation.
Q:Recall the Penny fab two. Fill in the blanks both in the following table and the equation.
T:回想Penny fab two的案例,填滿下列表格與方程式的空格。

E:各站的產出速率,可以先計算一個機器的產出速率,再乘以機台數目,公式寫作:Station Rate= (Number
of Machines)*1/(Process Time)
A:填寫Station Rate後的解答如下:

我們可以根據上表,Station Rate最小的Station 2為瓶頸(Bottleneck),因此瓶頸速率rb= 0.4 (pcs/hr)。T0則為整條生產線的Process Time的總和,故T0=2+5+10+3=20 (hr)。w0可利用計算關鍵在製品水準的公式計算出來為0.4*20=8 (pcs)。
Q:Recall the HAL case, answer the following questions.
Q:Recall the HAL case, answer the following questions.
a) What are the values for rb
and T0?
b) The performance of HAL is as follows. CT = 34
days = 816 hours; WIP = 47,400 panels; TH = 71.8 panels/hour. Please benchmark
with its PWC performance
c) Please mark the location of HAL at the
following chart
 |
| HAL Case Data |
T:回想HAL案例,回答下列問題。
a) rb和T0的值為多少?
b) HAL的效率如下所列。生產週期時間為34(天);在製品有47,400(片);產出速率為71.8(片/小時)。請以PWC效率來比較。
c) 請在下列的圖形上標記HAL案例所在的位置。


A:
a)瓶頸為生產速率最慢者,從提供的表格上,可找到Internal Circuitize的114 (parts/hr)為rb。而T0為整個生產流程的加工時間總和=4.7+0.5+3.6+1+2+4.3+1+10.2+1+4.1+1.1+0.5=33.9(hr)。
a)瓶頸為生產速率最慢者,從提供的表格上,可找到Internal Circuitize的114 (parts/hr)為rb。而T0為整個生產流程的加工時間總和=4.7+0.5+3.6+1+2+4.3+1+10.2+1+4.1+1.1+0.5=33.9(hr)。
b)要與PWC狀況比較,因此要先利用現有的資料來計算PWC的CT或是TH。
從PWC狀況下的TH公式,
 |
| TH for PWC |
所以我們先計算出W0再將w=47400(panel)與rb=114(parts/hr)代入,求TH。
| Critical WIP Calculation |
 |
| TH for PWC |
c)如下圖所示

留言
張貼留言